Published: Feb 14, 2024 by Cristian Pérez Corral, Christian Aberturas López
Kx Insights Enterprise: Simplifying Data Analytics
This post serves as a concise exploration of the versatile capabilities within Kx Insights Enterprise, highlighting its role as the premier cloud-based platform for efficient time series analysis. Leveraging the robust capabilities of kdb+ vector databases, this tool stands out not only for its exceptional speed but also for empowering users— particularly those without advanced technical expertise— to seamlessly develop data ingestion processes, query engines, and visualizations. The post will be structured as follows:
-
Use Case: Delving into a specific use case, we will employ an illustrative example using telecommunication network data. This section aims to explain the kind of data we start with and the functionality we want to derive from it.
-
Was it always this easy?: In this first technical section, we will guide you through establishing a straightforward data pipeline. It explores the steps involved in gathering key stream data and demonstrates how to leverage Kx Insights Enterprise’ capabilities for insightful analysis. The overall aim is to highlight the simplicity of working with the tool.
-
The Hardest; The Easier: This section takes a deeper dive by introducing a more intricate pipeline, showcasing the tool’s adaptability and advanced capabilities. It aims to reveal the tool’s capacity to handle complex scenarios and provide solutions even when faced with challenges.
As we progress through these sections, you will gain a comprehensive understanding of how Kx Insights Enterprise transforms intricate time series analysis tasks into manageable and insightful processes, making it an invaluable asset for both seasoned professionals and those new to the field.
ℹ️ To facilitate your engagement with the post, please refer to the following Github repository. There you will find sample data, code snippets, schemas, and other utilities that will allow you to reproduce the results from this report.
Use Case
Let’s consider a scenario where we are a telecommunications (telco) company deeply involved in the dynamic world of high-density real-time telco data. In this situation, our goal is to empower our Data Team with a robust system for in-depth data analysis and insightful conclusions. The provided data have several fields that will be explained deeply in a later section, but to ilustrate the use case we can preview some available records:
| ts | cellID | phase | imsi | imei | dspeed | uspeed | lat | lng | cellDistance |
|---|---|---|---|---|---|---|---|---|---|
| 2023-12-29D09:04:41.721100000 | 8c314ca8-7d12-44d0-933d-015d0e3d951a | 1 | 100000000000001 | 507552665363501 | 280.2945 | 57.12098 | 38.51778 | -89.06238 | 2.124557 |
| 2023-12-29D09:25:41.721200000 | 51587a43-60ef-42ea-88c9-b3128413870a | 1 | 100000000000002 | 868646385084695 | 317.5947 | 62.77128 | 38.84545 | -89.6521 | 2.570359 |
Basically, these records show information about calls from users located at a certain longitude and latitude, through a specific cell of the telecommunication network. To analyse this data, we will create comprehensive dashboards that visually represent key metrics. We have identified specific elements that will be pivotal in enhancing our operational understanding:
-
User Distribution Heatmap: Our objective is to gain insights into the geographical distribution of our users in real-time. The User Distribution Heatmap within Kx Insights Enterprise will vividly illustrate the concentration of our current users, allowing us to promptly identify high-demand areas.
-
Network Performance Analysis (Line Graph): Understanding the impact of network density on speed is critical for ensuring a seamless user experience. Through Kx Insights Enterprise, we plan to deploy a Line Graph that dynamically illustrates network upload and download speed variability, enabling proactive optimization of our network performance.
-
User Location Tracker: The ability to locate users within a specific geography is essential for targeted interventions and optimizations. Kx Insights Enterprise will provide real-time information on the geographical whereabouts of our users, facilitating strategic decision-making.
-
Failure Analysis TreeMap: Identifying and resolving issues promptly is key to maintaining a high-quality service. A TreeMap, powered by Kx Insights Enterprise, will pinpoint users experiencing difficulties with their connection, enabling us to swiftly address issues and ensure a seamless communication experience for our users.
For our development journey, we’ve chosen to leverage the use case outlined earlier for two compelling reasons: the data’s temporal nature, allowing for the utilization of time series analysis tools, and its high density. By doing so, we aim not only to demonstrate the prowess of Kx Insights Enterprise but also to shed light on the underlying machinery powering it—the kdb+ database.
ℹ️ Please note that the data presented is specifically crafted for this illustrative example and does not originate from real telecommunication sources.
Was it Always This Easy?
Our decision to use Kx Insights Enterprise for implementing the use case described in the last section is driven not only by the nature of our data, characterized by a vast volume of real-time information, but also by the platform’s exceptional capabilities in constructing functional pipelines, executing complex queries, and delivering compelling visualizations. To appreciate these capabilities, let’s suppose we would need to construct a similar architecture using only kdb+/q and other KX tools. Then, the question arises: How challenging would this endeavor be? Here, we succinctly outline some of the crucial steps that should be undertaken:
-
Build a Kafka Consumer: Constructing a Kafka consumer entails delving into the API, understanding its intricacies, and developing the necessary infrastructure to facilitate seamless data consumption.
-
Orchestrate the Pipeline: Docking the pipeline involves implementing all the transformations essential for processing real-time data. This step requires careful consideration and meticulous execution.
-
Develop Graphic Tools: While the Grammar of Graphics package is a powerful tool, we would still need to create a system for visualizing the aggregated data. We could use KX Dashboards to power this process, but we would still have two different applications, potentially leading to IPC technical specification challenges.
Beyond these tasks, there’s the challenge of working with an event handler for streaming data, which is not always straightforward. Additionally, packaging all these components into a black-box-like application is necessary to empower the entire data team to work with it, regardless of their technical expertise. Moreover, generalizing this solution for any conceivable use case poses an even more significant undertaking.
The solution presented in this post using KX Insights Enterprise wraps all this complexity in a user-friendly web interface, eliminating the need for the data team to possess intricate technical knowledge. To walk the reader through this tool as easily as possible, we will follow the recommended steps of Kx Insights Enterprise, which can be seen in the following image:

Deploying the database
Once we have accessed the Build a Database tab, we can configure it to suit our specific needs. For simplicity, we will leave the technical specifications (memory, storage, etc.) at their default settings, thus avoiding delving into unnecessary technical details.
Our database (which we will name db-telco) will include the main table. This table is where real-time telephony data will be stored (and from where the heatmap, tracker, and volume views will capture the data). It will have 10 columns, as seen in the records example, which are:
ts: The timestamp of the network trace for the record (timestamp type).cellID: The ID of the cell on which the trace is being transmitted (symbol type).phase: Indicates the data source’s release stage (int type).imsi: The ID of the SIM card participating in the trace (string type).imei: The ID of the device participating in the trace (string type).dspeed: The download speed of the network for this particular event (float type).uspeed: The upload speed of the network for this particular event (float type).lat: The latitude of the device from which the event is taking place (float type).lng: The longitude of the device from which the event is taking place (float type).cellDistance: The distance to the cell of the device (float type).
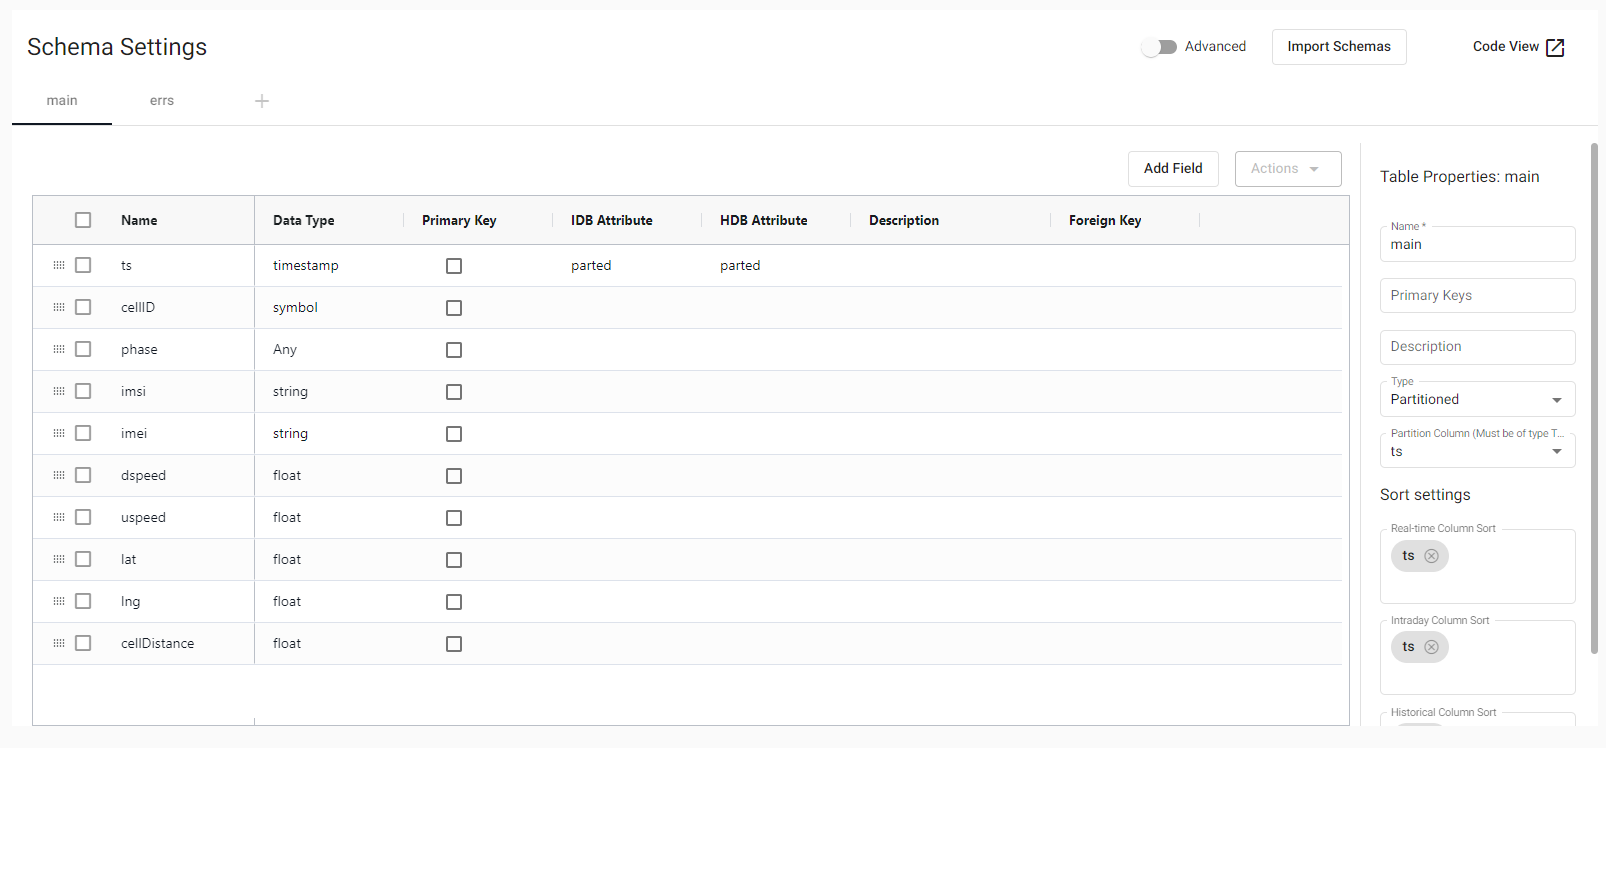
After creating the schemas for the table, we save and click on Deploy, and with that, we have the database up and running!
Data slide: the pipeline
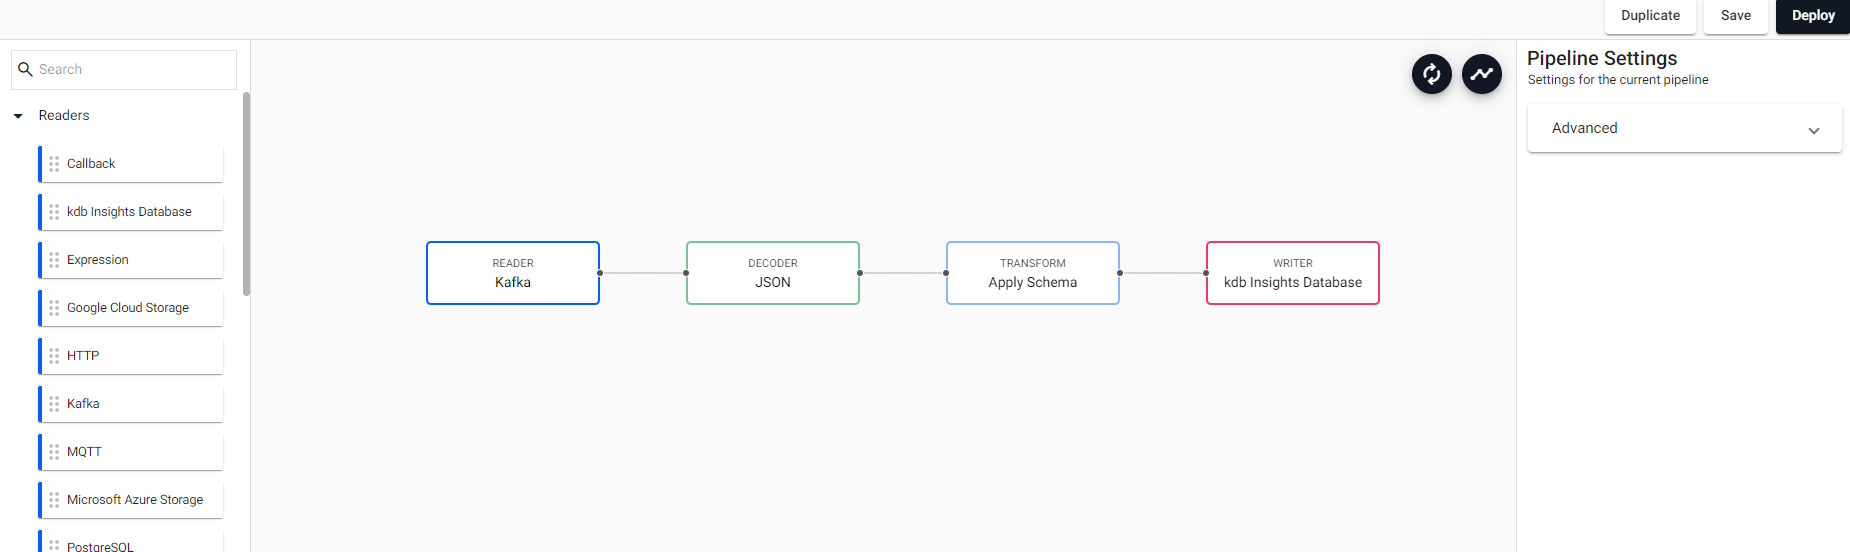
When it comes to data ingestion, pipelines are employed. The tools provided by KX Insights Enterprise for the creation, analysis, and testing of pipelines are extensive and straightforward to use, as we will see below. Constructing the pipelines using the web interface (i.e., going to Import Data in the Overview window) is pretty straightforward and gives us a basic pipeline that will have four fundamental parts, which can then be further complicated or supplemented with others, namely:
- Reader: The reader for Insights pipelines is highly versatile, allowing data ingestion from multiple sources, as depicted in the image below.
- Decoder: The decoder, responsible for transforming data received through the reader from different formats (JSON, CSV, etc.) into a q datatype.
- Apply Schema: Shapes the incoming data through ingestion. It can be any type of data, tabular, or an array.
- Writer: This last component, as its name suggests, is responsible for writing the received data into a table in a previously created database.
Let’s create a pipeline for the ingestion of telephone data, provided by a Kafka service. To achieve this, having chosen Kafka as the data source (selecting the corresponding broker and topic), JSON as the decoder, the schema of the main table seen earlier, and writing to that table, we end up with the following:
We will be writing in a database stored in the Kx Insights Enterprise architecture, but this is not the only place we can store the captured data. Some of the other options are a Kafka Topic, Amazon S3, and more. If you want to delve deeper into the pipeline operators, you can refer to the documentation.
Before having a functional pipeline, a couple of things need to be done.
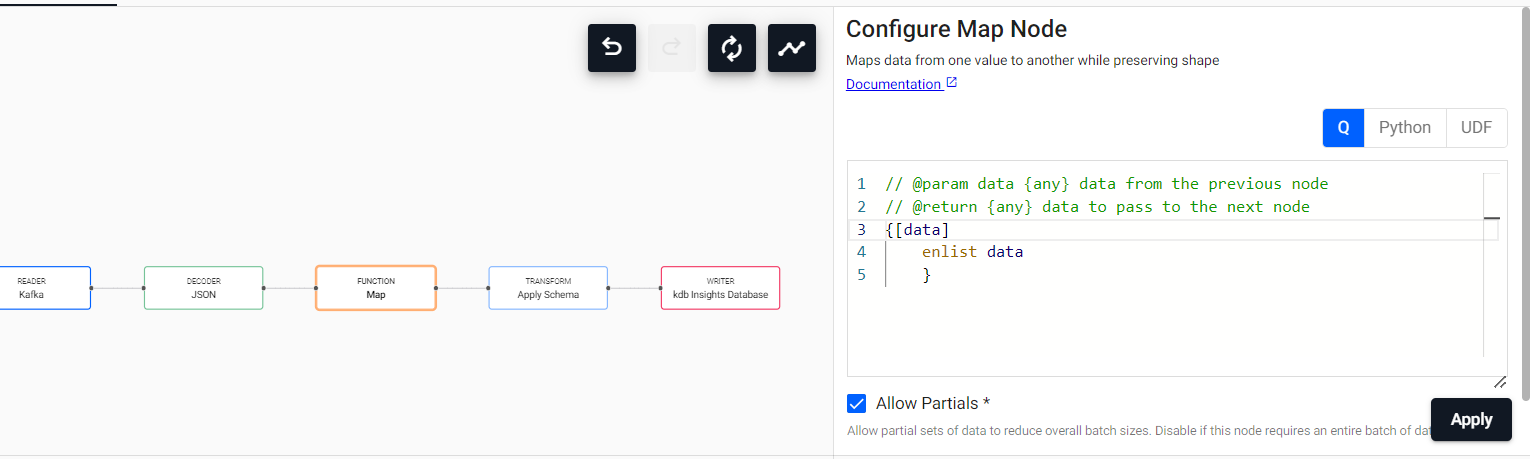
Firstly, as we are getting JSON-format data, we will have to decode it. The data arriving through the Decoder is in dictionary format (as is the main approach for JSON data), but the Apply Schema expects tables. We need to transform the data, which can be easily done through an additional intermediate step. Particularly, let’s use the dropdown on the left, looking for the Map cell. Map applies the map() function to the incoming data, transforming all data in the stream. In this case, as the output of the Decoder is a dictionary, and a table is expected, the only function to apply to the data is the q enlist.
ℹ️ This step must be included because the captured data is in JSON format. If we would have CSV-like streaming data, we wouldn’t need to transform it to tables, as the usual interpretation of CSV is table-like.
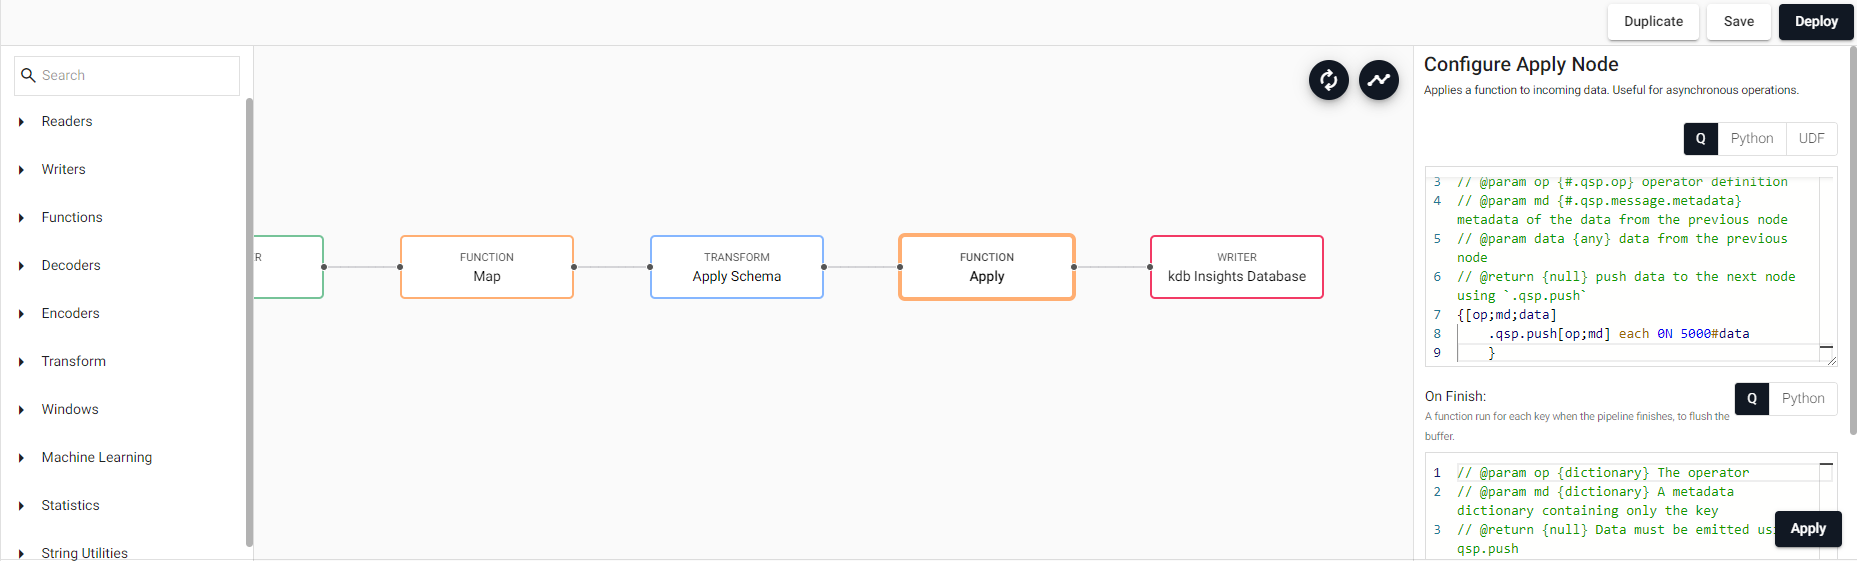
Additionally, considering the potentially high data density, it is advisable to incorporate an intermediate step before writing to the database – an Apply function. This function facilitates a gradual transfer of data to the writing process at a more measured pace, storing it in batches. By minimizing the frequency of database writer calls, we mitigate the risk of efficiency reduction. This practice is recommended to prevent component overload, which could otherwise result in processes being terminated due to out-of-memory (OOM) issues. It’s worth noting that this technique is commonly employed in other platforms for real-time data ingestion, underscoring its effectiveness and reliability.
The magic of Insights lies precisely in the fact that, with a minimal amount of code, we have managed to deploy a real-time massive data ingestion pipeline. You don’t always need to be technical to work with data!
Querying the data
We will need to understand how the data is stored to query it effectively. Kx Insights Enterprise supports three types of storage tiers: RDB, IDB, and HDB, each with specific characteristics:
- RDB stores only real-time data, with just a small amount of timelapse.
- IDB stores data as intervals from real time, and from time to time, the pipeline will send a signal indicating either the start or the end of a new interval, and then all the data will be stored in IDB as batches.
- HDB stores historical data. Once enough time has passed since the data was stored in IDB, it moves directly to be stored in HDB.
Therefore, the streaming data will go through RDB → IDB → HDB. As we are doing a real-time process, we will primarily work with RDB, as we will see briefly.
ℹ️ If you want to know more about the different storage tiers, please check the documentation.
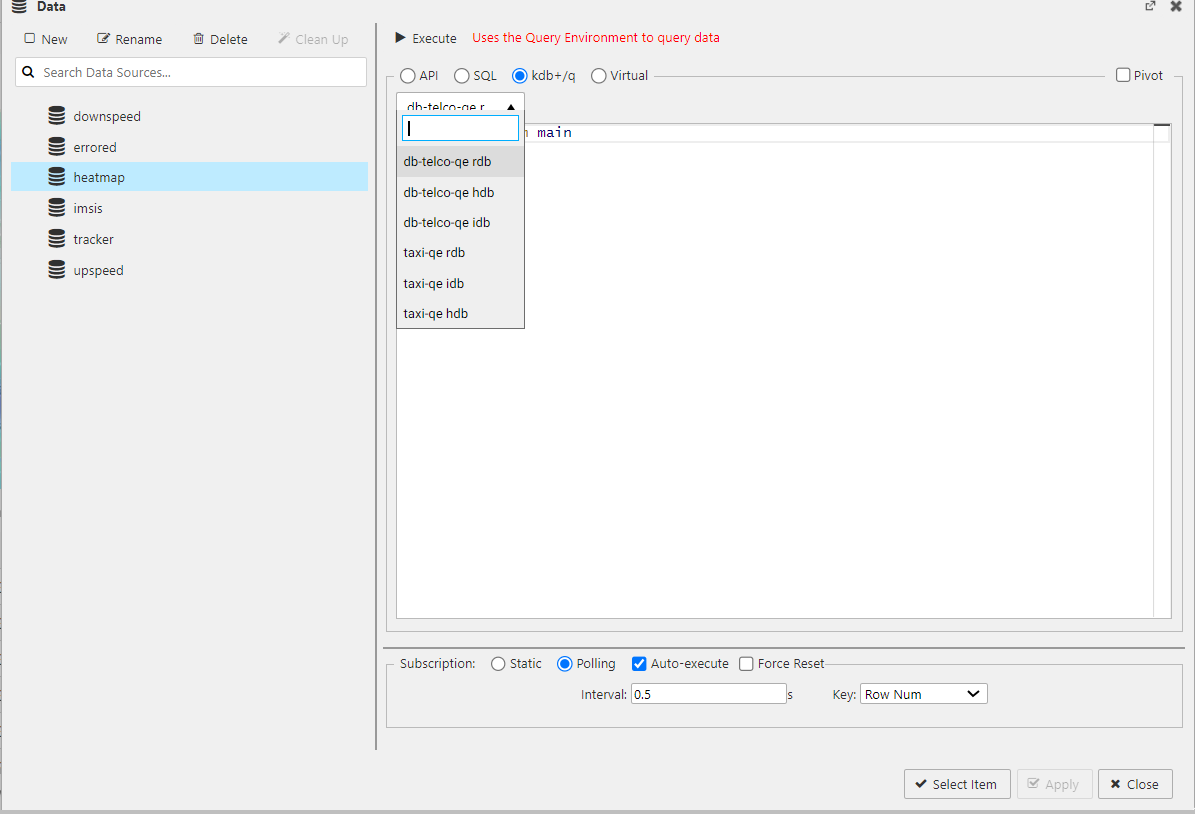
To examine the data, let’s navigate to the “Query” section, where we will encounter something like this:
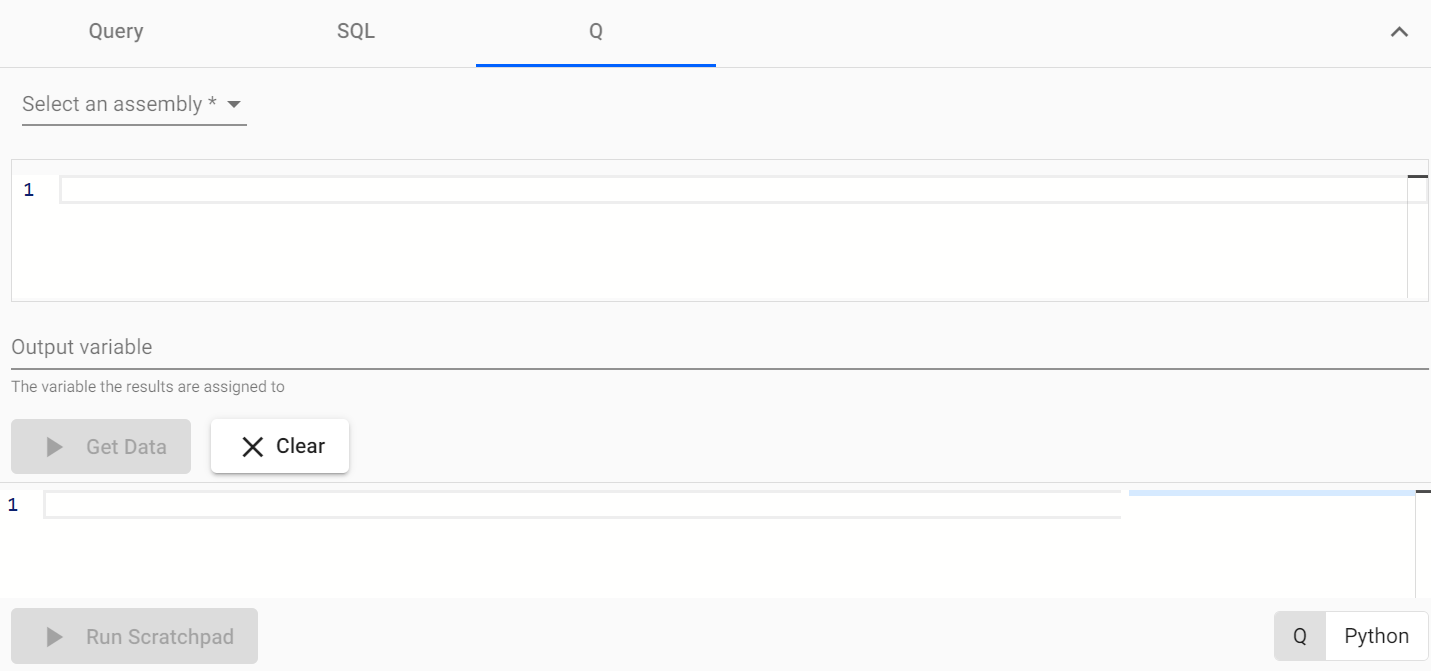
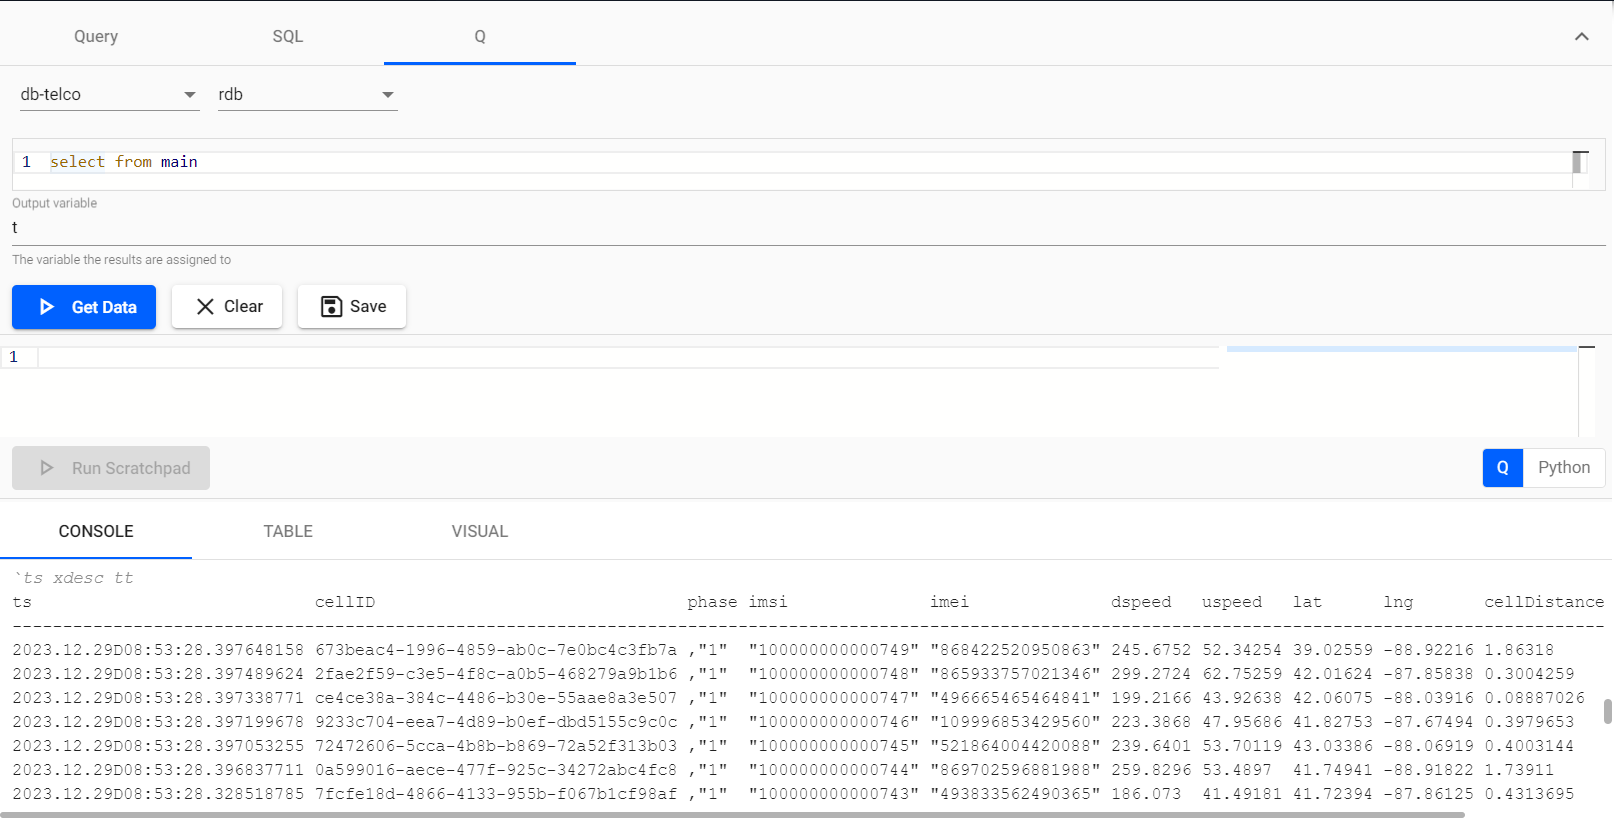
Once here, we have three options for querying the data: using the API, employing SQL, or utilizing q. By using q, we can perform various transformations with simple commands, so let’s proceed with it. As we observed in the pipeline, we are storing the data in the main table and querying from its stream tier rdb.
❓ In Kx Insights Enterprise, querying can be conducted through two primary avenues: the native q language and the API. The q language allows for detailed control and optimization of queries, suitable for complex data manipulation across various databases (RDB, IDB, HDB). In contrast, the GetData API presents a more abstracted and streamlined querying interface. This design conceals the precise storage location of the data, thereby obviating the necessity for comprehensive knowledge of the q language. Such an approach significantly simplifies the process of data access and integration. Looking ahead, Kx Insights Enterprise will prioritize the use of the API for data queries over the native q language. This strategic preference is designed to standardize access methods and significantly enhance the usability and efficiency of data querying across the platform. This evolution in querying methodology has been exemplified in the use of Dashboards.
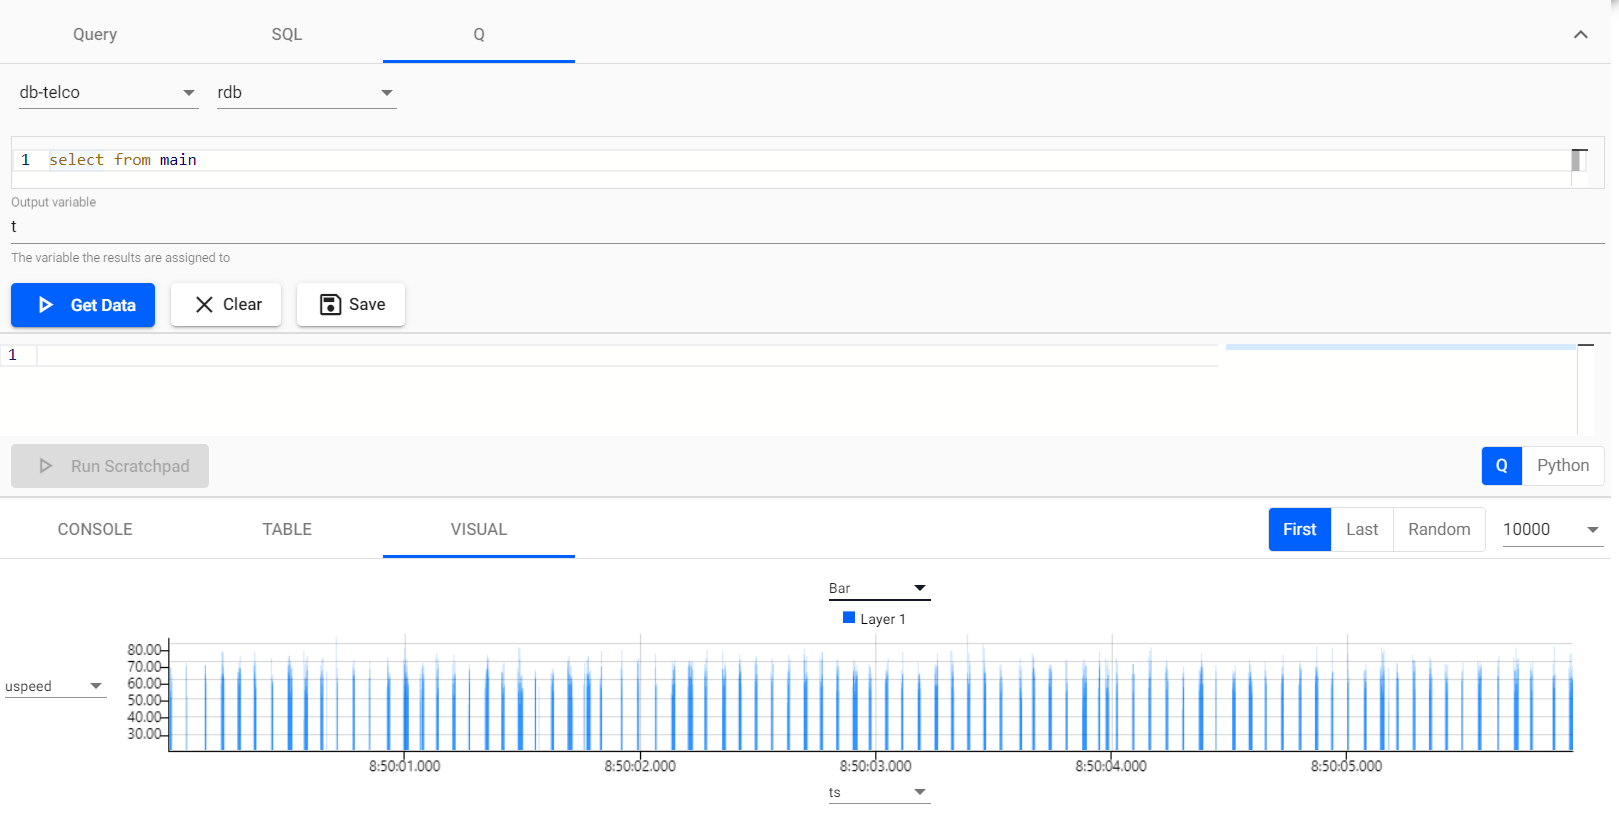
We can even do a little analysis of the speed of the network data using the “Visual” window below, as follows:
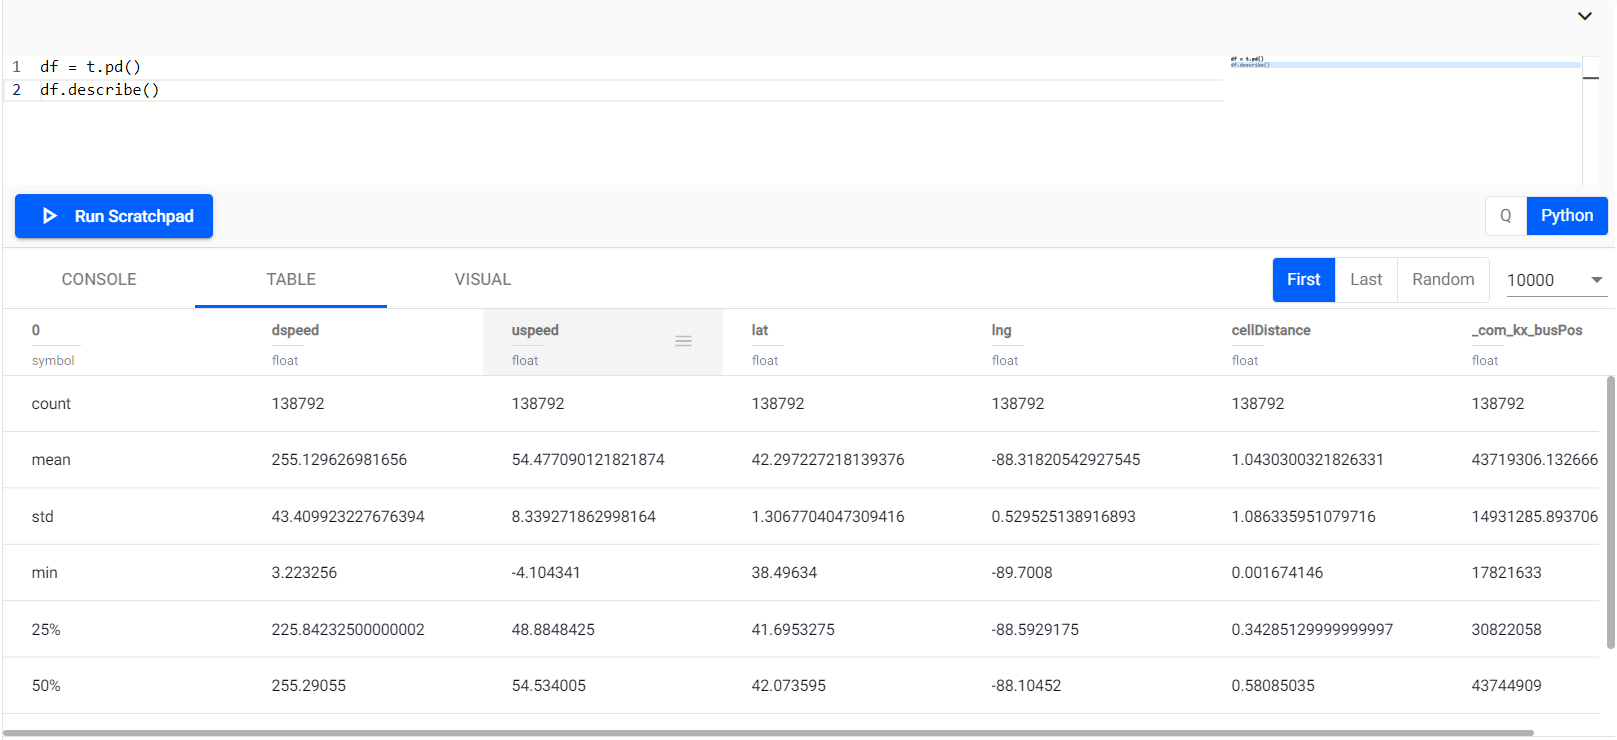
And also, using PyKX, we can check the different statistics of the table as easily as working with Pandas!
Enjoying the views
Now that we have stored the data, what about analyzing it? This section allows us to create dashboards with the data we are ingesting through the pipeline and analyze it in several ways! The interface is pretty similar to the one our colleague Óscar explained in this post, so we are skipping most of the setup part. Nevertheless, there are two things that may have to be explained:
Stream Connectors
As in the dashboards post, when you declare a view in Kx Insights Enterprise, you have to create a data source that will ingest data from a database. As mentioned before, Insights has three different default databases: RDB, IDB, and HDB. As we are analyzing real-time data, most of the time we will ingest from RDB, as seen below (image from heatmap datasource).
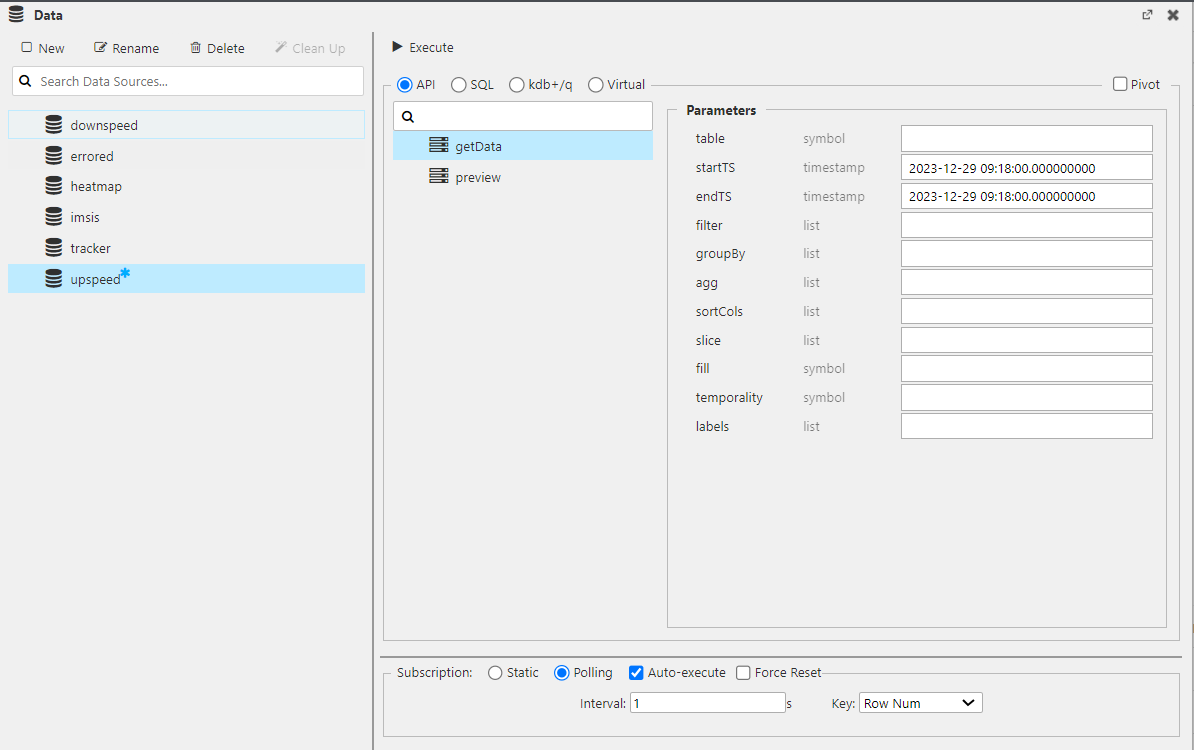
Also, as in the query engine, you can just use the Insights API to query the data from any of those databases, as you can see in the following image:
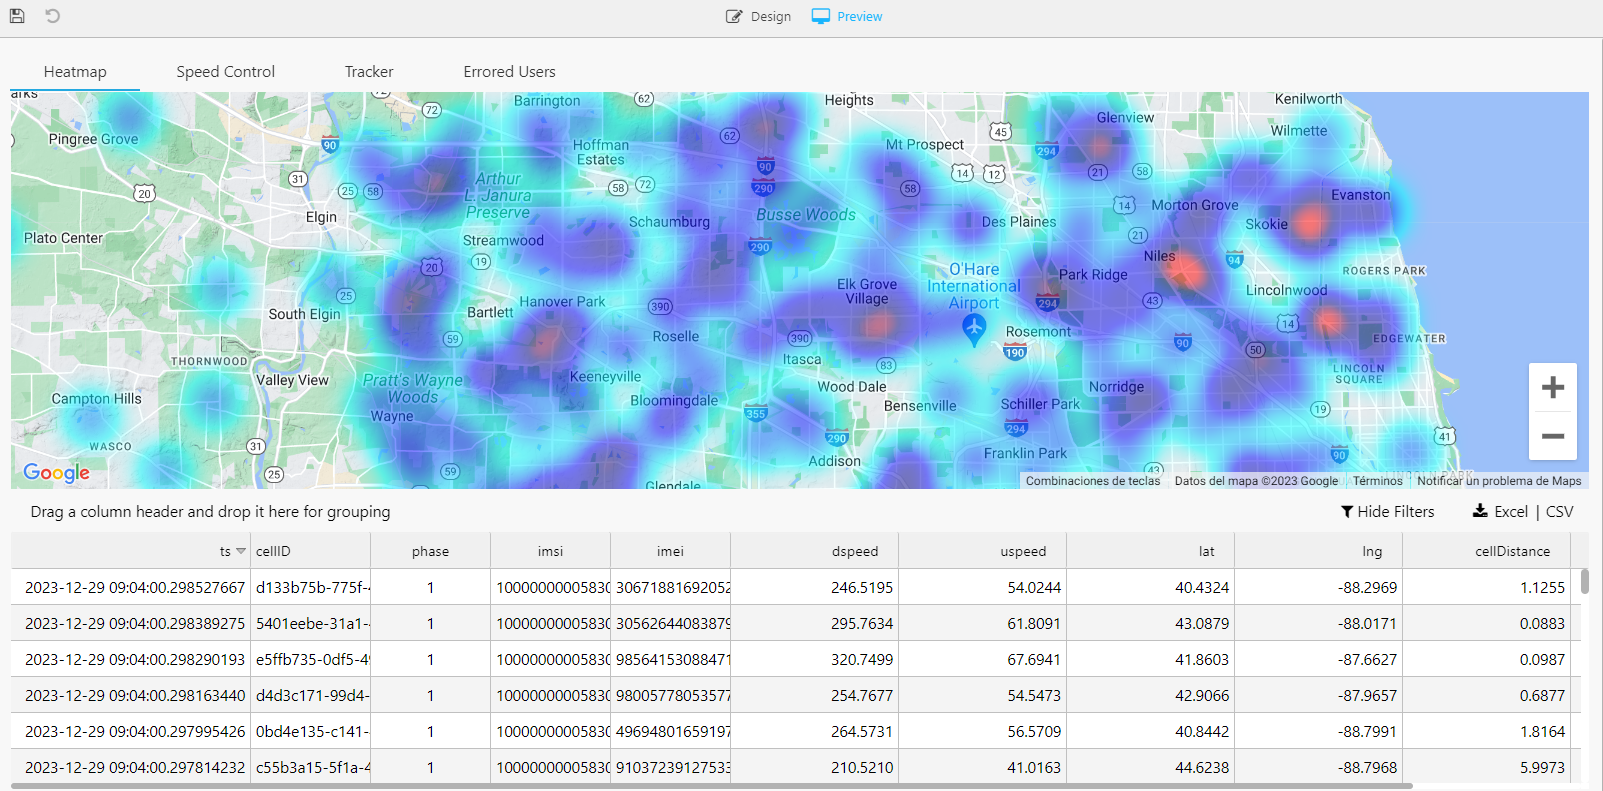
Heatmap
First, we have created a heatmap that updates in real-time. This innovative heatmap dynamically illustrates user density across, in this case, Chicago. This live update feature ensures that the data displayed is always current, providing an accurate and up-to-the-minute view of network performance. This information enables us to optimize network coverage and capacity where it’s most needed.
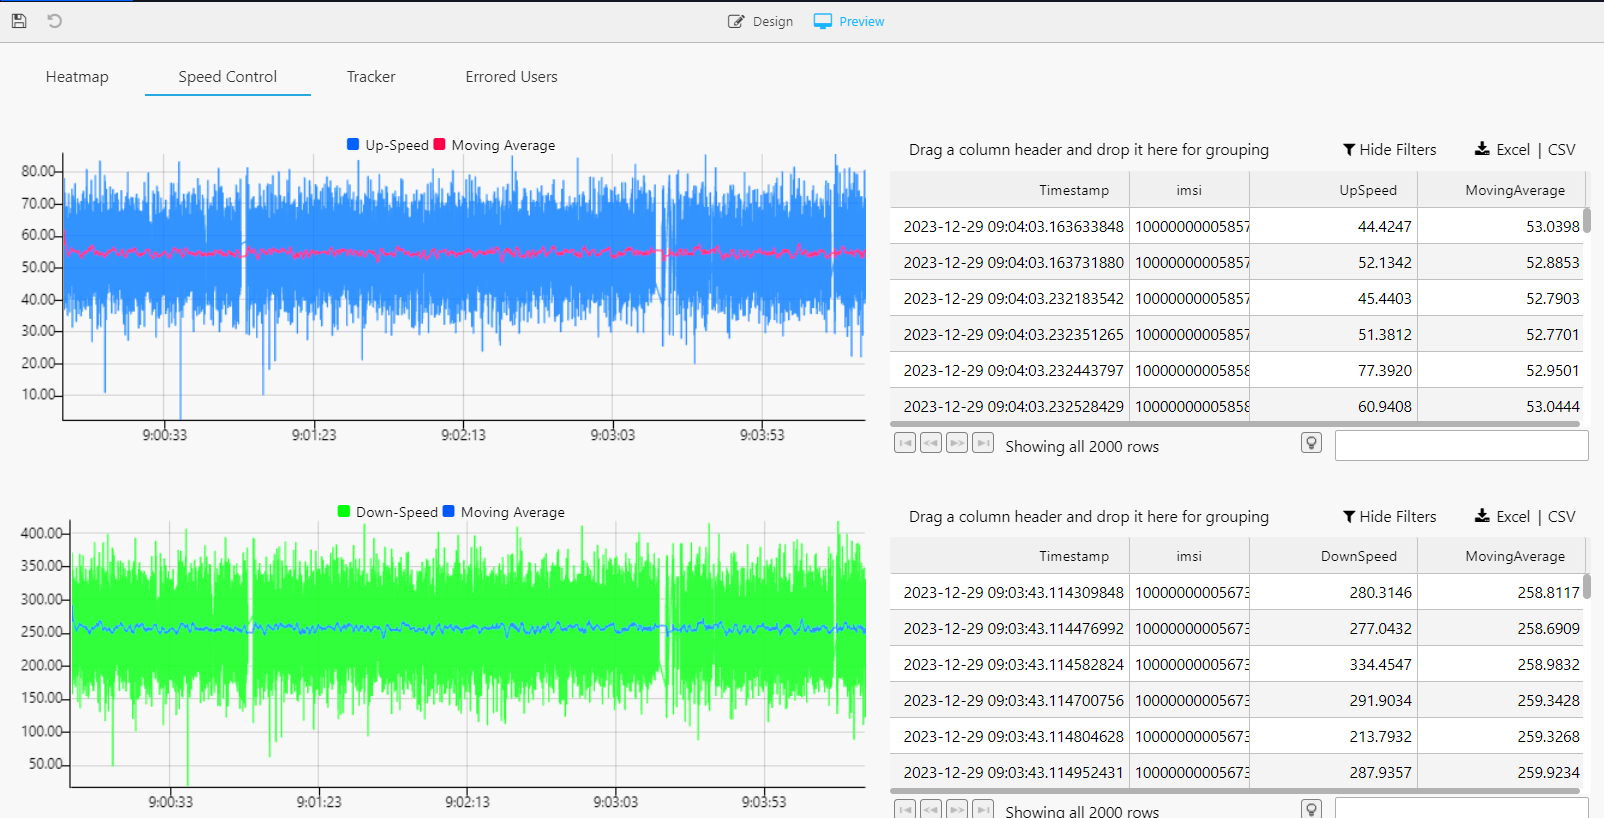
Speed
We have also created a dashboard where we plot both the upload and download speeds of different connections in real-time. This gives us information about how our network is working in general terms. In essence, this speed tracking dashboard is a key component in our toolkit, enabling us to continuously monitor and improve the overall health and performance of our network.
Tracker
We have created a dashboard that acts as a tracker, allowing us to follow the locations of the different connections that the user makes. It maps out the geographical journey of users by pinpointing where and when they establish network connections. This level of detailed tracking is invaluable for understanding user mobility and network usage patterns.
![]()
Up until now, our data ingestion has revolved around high-density, real-time data utilizing the fundamental modules offered by KX Insights Enterprise. Moreover, we’ve successfully illuminated the insights derived from this data through the integration of Dashboards. Consequently, the inquiry arises: how can we further enhance this process?
The hardest; the easiest
We have ingested and queried our data, and everything is working quite well. Why don’t we make it a little trickier? In this section, we will briefly comment on a little upgrade to the pipeline built in the previous one, following the same structure (i.e., database → pipeline → query → dashboard). Shall we begin?
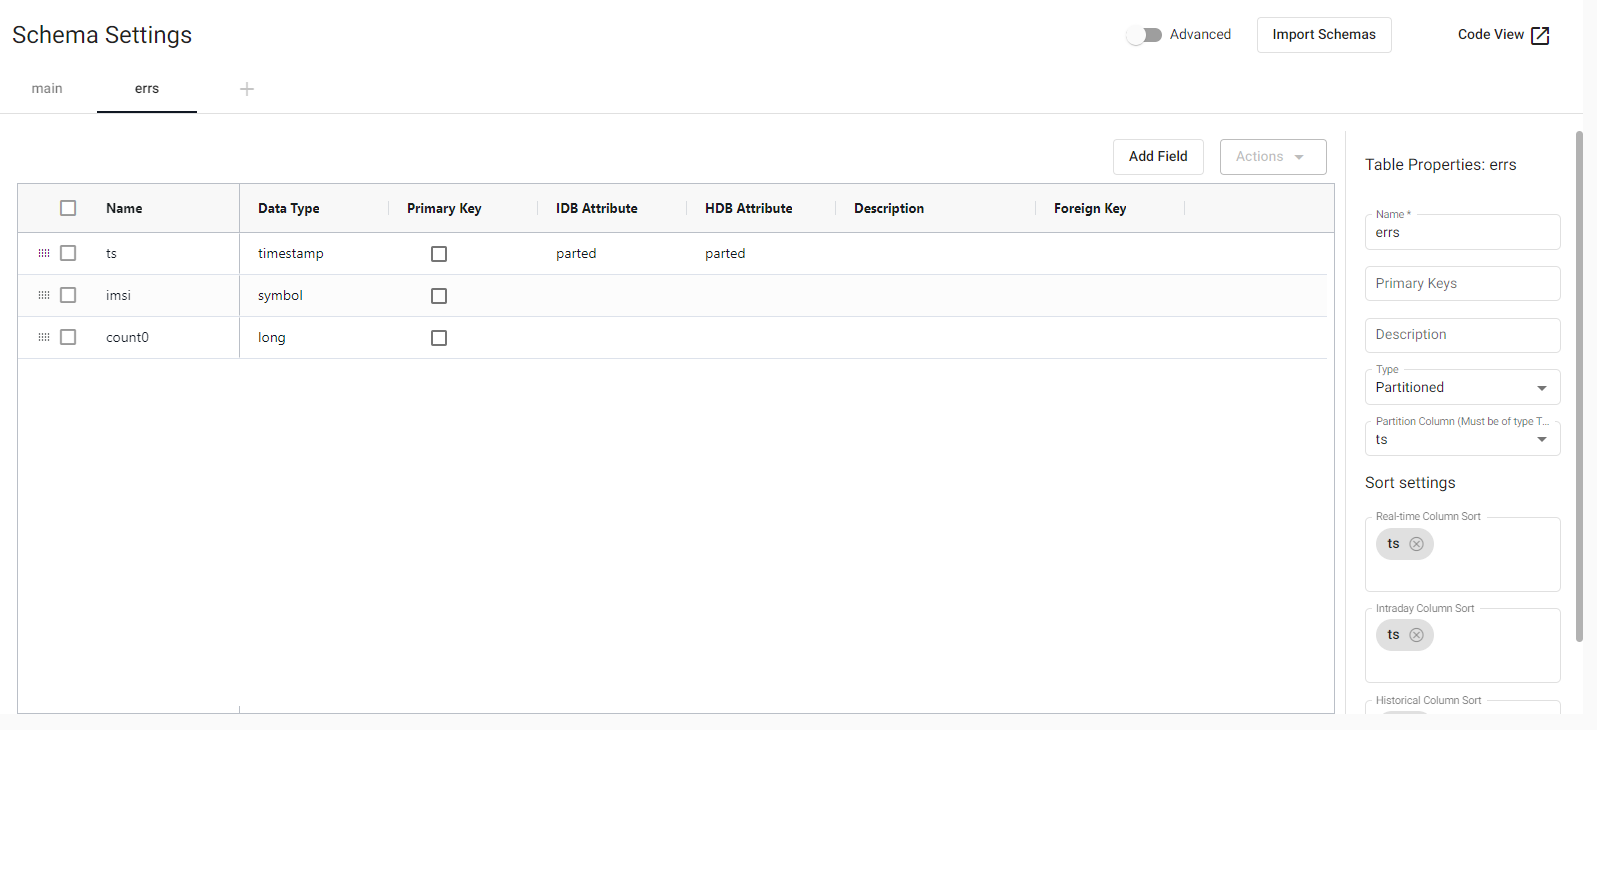
Let’s create the errs table. This new table will be used for a subsequent grouping to study errors in the network (and assist users with the highest error rates). It will have three fields (we have already seen ts and imsi):
count0: This counts the errors that have occurred in the network in the grouping (int type).
Presently, our focus shifts towards storing data in this context. The collection of information concerning users with the highest error rates holds significant utility for promptly addressing their concerns, resolving issues, and maintaining client satisfaction. This entails bifurcating our data stream into two distinct segments: the previously highlighted stream that populates the main table, and the one under consideration here. To facilitate error storage, we intend to aggregate the data, aiming for the utmost precision in error-related information.
To aggregate the data, we will use a new module:
- Timer Window: This one will store the streaming data by a specified time (in this case, 1 minute).
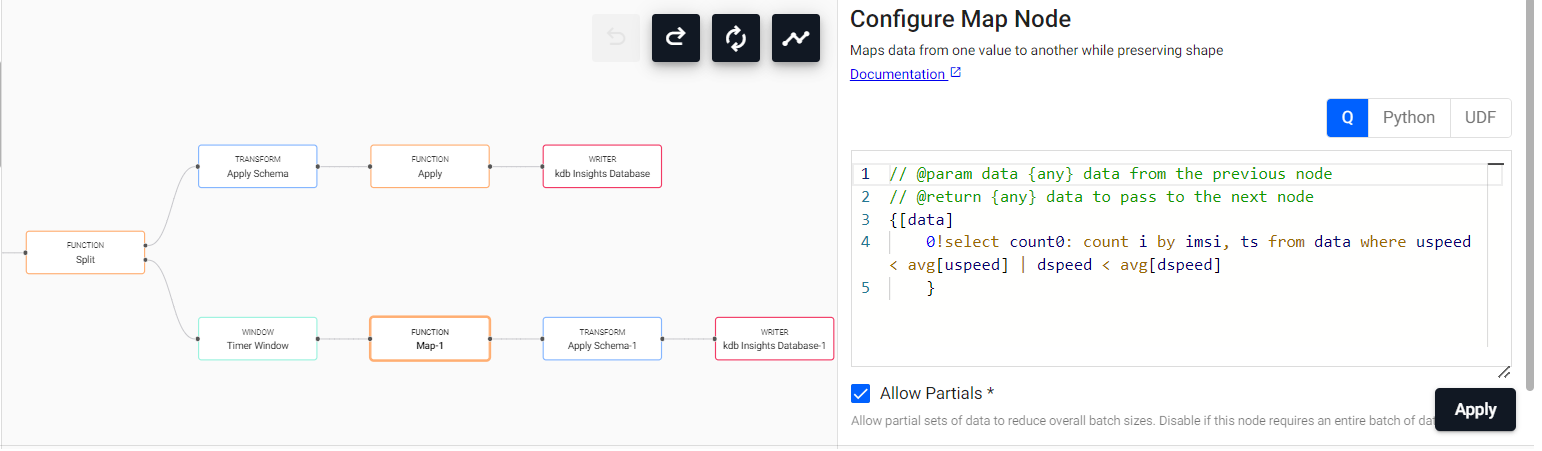
Once our Timer Window has stored the last minute of data, we will aggregate it using a Map. The map function will aggregate by imsi, counting the times that the speed of some user is lower than a given threshold.
0!select count0: count i by imsi, ts from data where uspeed < avg[uspeed] | dspeed < avg[dspeed]
Once done so, we will store our data in the errs table. Using Apply Schema again will work out.
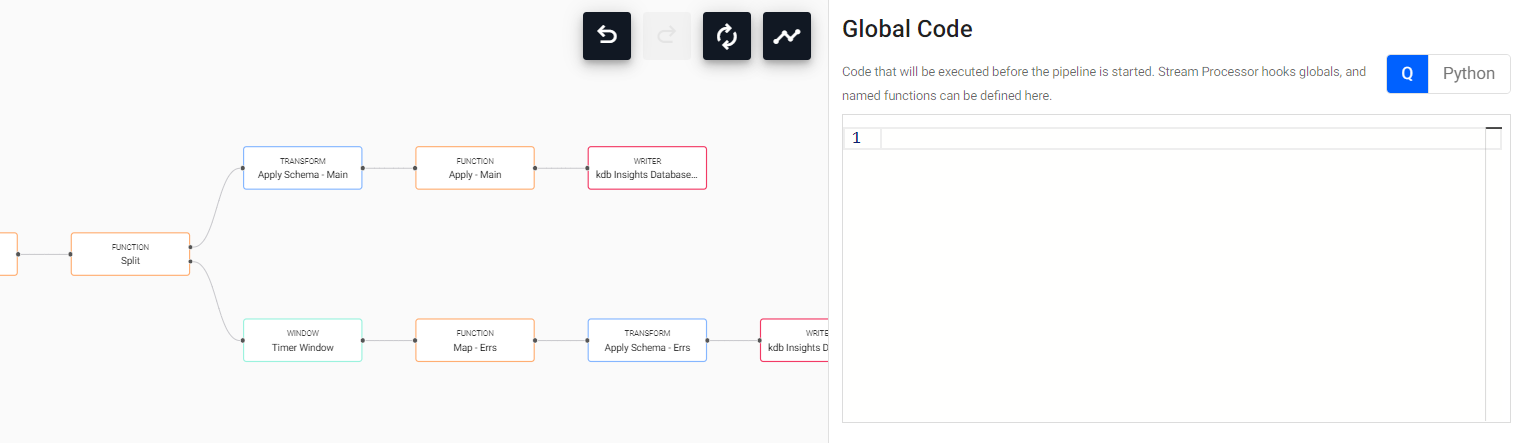
As we can see, repeated modules have the same name, with a numeric identification. To change it for clarity, we can Right Click → Rename Node and write down the desired name for each node. Then, we would have our pipeline finished, as something like this:
Having established our pipeline for loading the errs table with data, the subsequent step involves verification to ensure its functionality. To accomplish this, it is necessary to return to the query engine and modify our code statement accordingly, querying from the newly created table to assess its operational status.
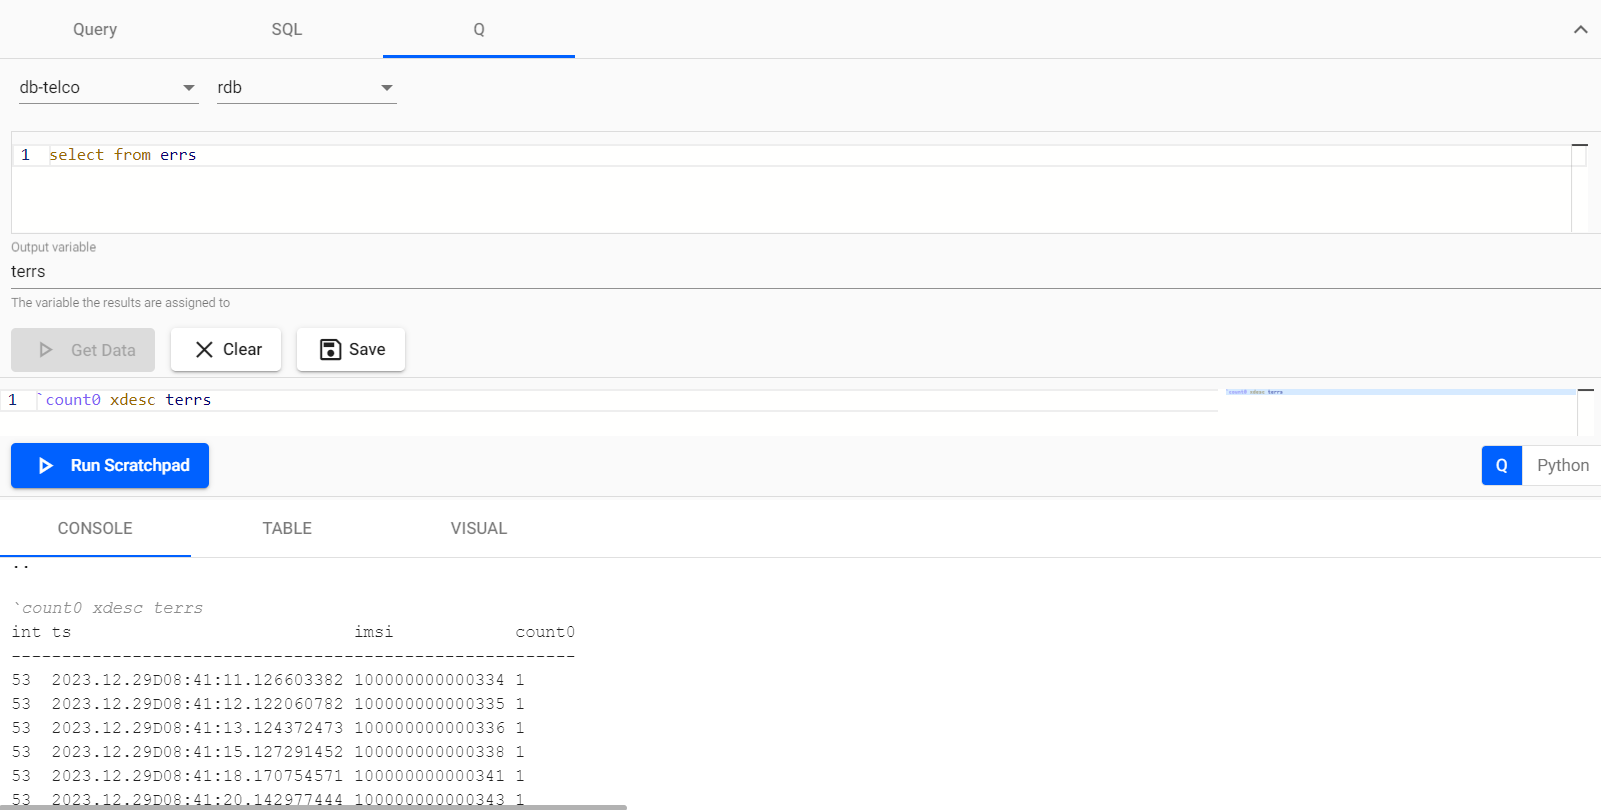
And voilà, we have our high error rate users stored!
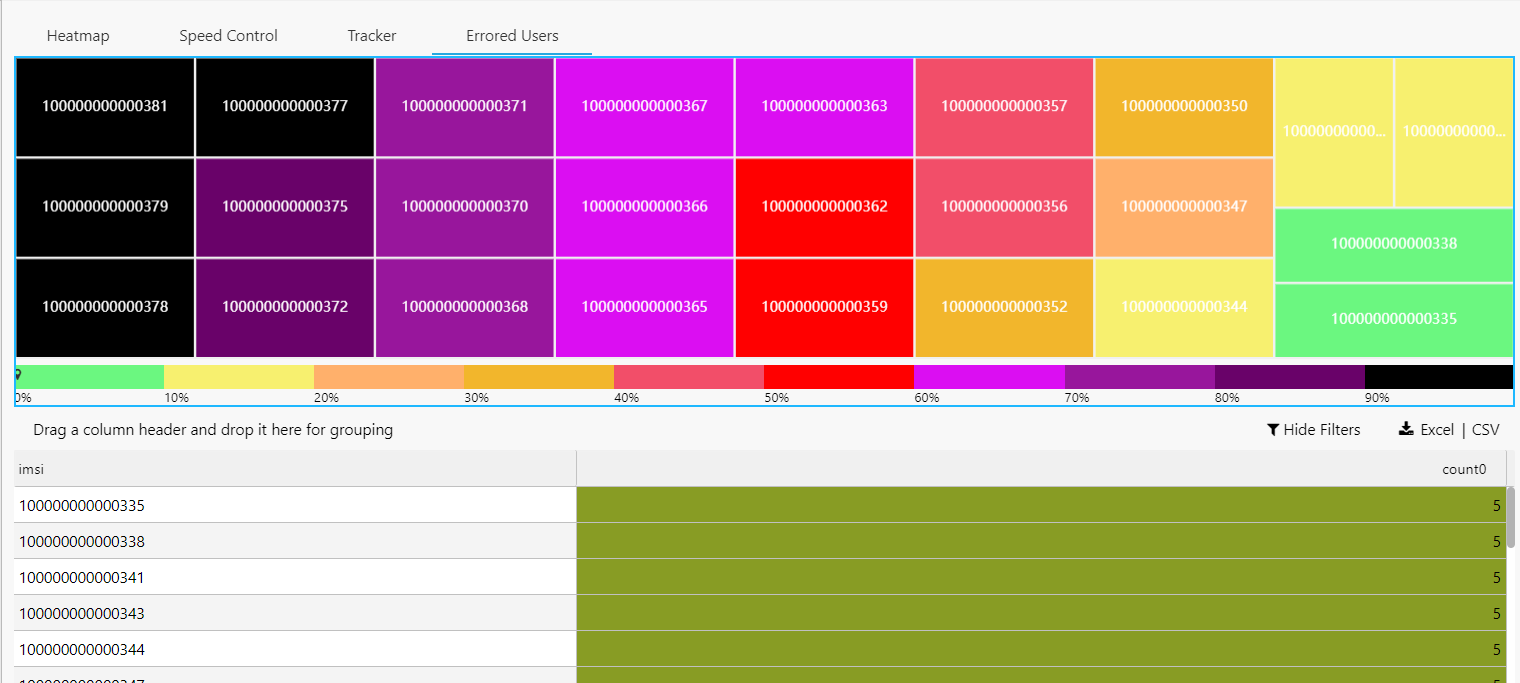
To visualize the errors, we have created a treemap where we represent the users who have experienced the most errors in the last few minutes. By categorizing and visualizing the errors encountered by our users, this treemap enables us to quickly identify and address the most common and pressing issues. This dashboard does not use the RDB but the IDB in order to aggregate through more time, so we are always aware of the last-minute state of user experience, allowing for swift and proactive interventions.
Conclusions
Throughout our exploration, it has become abundantly clear that KX Insights Enterprise stands out as an exceedingly convenient and proficient tool for crafting bespoke data analysis services. Its capabilities extend far beyond mere simplification – it substantially streamlines the complexities inherent in pipeline construction, data querying, and visualization. Remarkably, this tool empowers us to undertake such endeavors without the extensive technical expertise traditionally associated with similar projects. Consequently, we now find ourselves in possession of a thoroughly comprehensive and fully operational real-time data service.
Should you wish to gain a more profound understanding of this tool, we strongly recommend following the latest KX Academy demonstrations pertaining to Kx Insights Enterprise. While certain aspects covered in this post may coincide with these demonstrations, leveraging these accessible resources will enhance your ability to construct more extensive data-oriented systems:
- Build and backtest scalable trading strategies using real-time and historical tick data: KX Academy - Finance.
- Manufacturing Tutorial: Apply deep neural networks to streaming IoT data using MQTT and Tensorflow: KX Academy - Manufacturing.
- Integrate Kafka and kdb+ for real-time telemetry: KX Academy - Kafka Integration.
- Drag and Drop Application Design with kdb Insights Enterprise, Eoin Killeen: KX Community Meetup - Belfast
Should you desire to delve further into the technical aspects, you have the option to construct your own data ingestion process utilizing Kx Insights Enterprise, bypassing reliance on the web interface. The guidance provided in this post will assist you in navigating this undertaking:
- Getting Started with kdb Insights: Treliant - Getting Started.
Finally, to fully explore the capabilities of KX Insights Enterprise, you can Book a Demo directly with the KX team!
In conclusion, for a comprehensive collection of schemas, code snippets, and additional resources referenced in this post, please visit our GitHub repository:
- GitHub Repository: Habla Computing
Explore the full set of materials to delve deeper into the technical details and implementations discussed in this content. Please let us know if you encounter any difficulties, and have fun with Kx Insights Enterprise!
Acknowledgements
We extend our most heartfelt thanks to Alfonso Campo for creating the simulated data, and to Stephen Meany for his unwavering technical support.